BLOG POST
PPFD, DLI, and Efficacy Explained: The Only Three Numbers That Actually Matter
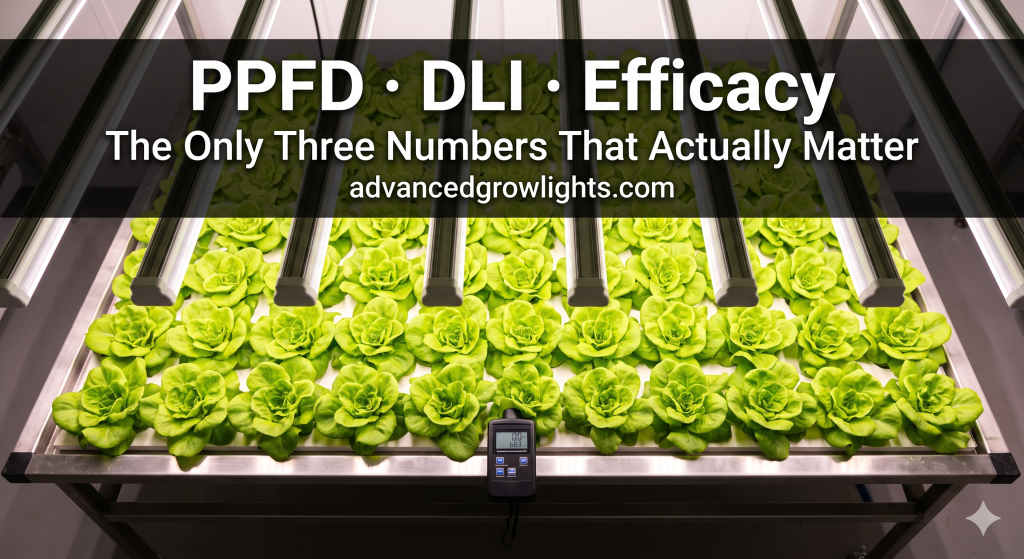
Walk into almost any grower forum, and you’ll still find the old heuristic: 30–50 watts per square foot for flowering crops. It gets passed around like gospel. It’s also nearly useless.
The watts-per-square-foot rule was a rough proxy developed in the HPS era when most commercial fixtures drew similar power and produced photons at roughly the same efficiency. Today, that assumption is dead. A 600-watt fixture from a premium brand running at 3.1 µmol/J delivers meaningfully more usable light than a 600-watt budget fixture running at 2.0 µmol/J — same wattage, very different canopy results. Watts tell you how much electricity a fixture consumes. They say nothing about how much photosynthetically useful light reaches your plants.
The professionals who run commercial CEA operations — tomato greenhouses, vertical lettuce farms, university research stations — stopped using watts per square foot years ago. They use three numbers: PPFD, DLI, and efficacy in µmol/J. Those are the only metrics that predict plant performance and operating cost with any reliability.
This post explains each one plainly, tells you what numbers to target by crop type, and shows you how to apply them when evaluating real fixtures in the AGL directory.
Stop Using Watts Per Square Foot. It Doesn’t Mean What You Think.
PPFD: The Intensity Number
What It Is
PPFD stands for Photosynthetic Photon Flux Density. It measures the number of photosynthetically active photons — light in the 400–700 nm range — landing on one square meter of canopy every second. The unit is µmol/m²/s (micromoles per square meter per second).
Think of PPFD as the rate of photon delivery to the leaf surface at a specific point in space. It is an instantaneous measurement, not a cumulative one. That distinction matters — and we’ll come back to it when we cover DLI.
How to Read a PPFD Map
Reputable manufacturers publish PPFD maps: a grid of measurements taken at a defined hanging height above a canopy, showing intensity across the entire footprint. A map might show values ranging from 1,100 µmol/m²/s at center to 700 µmol/m²/s at the corners. That spread tells you something watts never could: how uniform is the light distribution?
A few things to check when reading a PPFD map:
- Testing height: Most manufacturers test at 18–24 inches above canopy. A fixture looks more impressive at a greater distance because the footprint expands. Confirm the height used matches your real hanging situation.
- Average vs. center peak: Some brands headline the center-point peak reading, which is the highest number on the map. Average PPFD across the footprint is the honest metric. Look for both.
- Uniformity ratio: Divide the minimum reading by the maximum. A ratio of 0.75 or better is respectable for a single-fixture over a 4×4 foot area. Below 0.6 and your canopy edges are working with significantly less light than the center.
- Third-party testing: A PPFD map produced in-house by the manufacturer deserves more skepticism than one published with a DLC (DesignLights Consortium) listing or independent lab report. The AGL directory flags verified test data.
Target PPFD by Crop
| Crop | Growth Stage | Target PPFD (µmol/m²/s) | Notes |
|---|---|---|---|
| Lettuce / Leafy Greens | Full cycle | 150–300 | Higher end for butterhead and romaine; lower for baby leaf |
| Microgreens | Full cycle | 100–250 | Species-dependent; most perform well at the low end |
| Tomatoes / Peppers | Fruiting | 400–700 | Higher if CO₂ is supplemented above ambient |
| Herbs (basil, cilantro) | Full cycle | 200–400 | Flavor compound development improves with moderate-high PPFD |
| Cannabis | Vegetative | 400–600 | Light stress risk above 700 without CO₂ enrichment |
| Cannabis | Flowering | 800–1,000+ | Upper range only with CO₂ above 1,000 ppm; otherwise diminishing returns |
PPFD is not a “more is always better” dial. Every crop has a light saturation point — the level beyond which photosynthesis stops increasing and heat stress, bleaching, or tip burn can begin. Pushing 1,200 µmol/m²/s onto a lettuce crop will not produce larger heads. It will produce stress.
DLI: The Accumulation Number
What It Is and Why PPFD Alone Is Not Enough
DLI stands for Daily Light Integral. It is the total quantity of photosynthetically active photons that land on a square meter of canopy over an entire day. The unit is mol/m²/day (moles per square meter per day).
If PPFD is the rate of a water tap, DLI is how much water is in the bucket at the end of the day. A plant growing under 500 µmol/m²/s for 12 hours receives a very different light dose than one grown under 500 µmol/m²/s for 18 hours — even though the PPFD is identical. DLI captures that difference.
The Math
DLI is calculated directly from PPFD and photoperiod:
DLI (mol/m²/day) = PPFD (µmol/m²/s) × Photoperiod (hours) × 3,600 (seconds/hour) ÷ 1,000,000
Or simplified: DLI = PPFD × hours × 0.0036
A concrete example: A fixture delivering 800 µmol/m²/s over an 18-hour photoperiod:
800 × 18 × 0.0036 = 51.8 mol/m²/day
That is an extremely high DLI — appropriate only for high-intensity flowering crops with CO₂ supplementation. For comparison, peak summer sunlight in most of North America delivers roughly 60–65 mol/m²/day on a clear day.
Target DLI by Crop
| Crop | Target DLI (mol/m²/day) | Notes |
|---|---|---|
| Lettuce / Baby Leaf | 12–17 | Tip burn risk increases sharply above 20 |
| Microgreens | 8–14 | Fast turnover crop; modest DLI is sufficient |
| Basil | 14–20 | Higher DLI intensifies essential oil concentration |
| Tomatoes (greenhouse supplemental) | 22–30 | Commercial greenhouse standard; year-round production target |
| Cannabis (vegetative) | 20–30 | 18-hour photoperiod typical |
| Cannabis (flowering) | 35–45 | Upper range requires CO₂ supplementation for meaningful benefit |
DLI is also the key to understanding why greenhouse supplemental lighting strategies work the way they do. On a low-light winter day, a tomato greenhouse might receive 8 mol/m²/day from the sun. A grower targeting 25 mol/m²/day needs to supplement the deficit — 17 mol/m²/day — with artificial lighting timed around sunrise and sunset. You cannot calculate that supplement without knowing DLI.
DLI also connects directly to spectrum research, including the role of far-red light in extending the Emerson effect and pushing the effective DLI ceiling for some crops — a topic covered in more depth in our post on UV and Far-Red Supplemental Lighting: Science vs. Marketing.
Efficacy: The Operating Cost Number
What It Is
Efficacy, in the context of horticultural lighting, means the number of photosynthetically active photons a fixture produces per joule of electricity consumed. The unit is µmol/J (micromoles per joule).
This is the efficiency metric. It does not tell you how bright a fixture is. It tells you how efficiently electricity is converted into plant-usable light. Two fixtures can produce identical PPFD at the canopy — but if one does it at 2.0 µmol/J and the other at 3.2 µmol/J, the less efficient fixture is consuming 60% more electricity to achieve the same result. Over a commercial production cycle, that gap is not trivial.
What the Numbers Mean in 2026
The efficacy range across currently available commercial LED fixtures spans roughly 1.7 µmol/J (outdated or low-cost designs) to 3.6 µmol/J (current top-tier). Here is a practical interpretation framework:
- Below 2.0 µmol/J: Legacy technology or budget fixtures not built for commercial operation. Acceptable only for very small-scale hobbyist use where electricity cost is not a concern.
- 2.0–2.5 µmol/J: Older-generation commercial LED or current mid-market budget fixtures. Functional, but you are leaving money on the table over a full production cycle.
- 2.5–2.9 µmol/J: Solid mid-market performance. Appropriate for small commercial operations and serious hobbyists. The Lumatek ZEUS 600W PRO (2.85 µmol/J) and Spider Farmer’s mid-range fixtures fall in this range.
- 3.0–3.2 µmol/J: Current commercial standard for professional production. Fixtures like the Fluence SPYDR 3 (3.0 µmol/J) and the Gavita Pro RS 2400e (3.2 µmol/J) operate here. This is the threshold where commercial ROI math starts looking genuinely compelling versus HPS.
- Above 3.2 µmol/J: Premium territory. HLG’s top-line fixtures and a small number of others with the latest-generation diodes operate at or above this level. Independent lab data is important to verify claims in this range — the marketing noise increases proportionally.
The Efficacy Catch: Fixture vs. System
One thing to watch: manufacturers often report LED chip efficacy rather than fixture efficacy. The LED chips alone might achieve 3.5 µmol/J in isolation. But the complete fixture — with driver losses, thermal management, and optics — typically comes in 10–20% lower. Always look for fixture-level efficacy, ideally from a DLC listing or third-party lab report, not a chip spec sheet. The AGL directory standardizes on fixture-level data.
For more context on how fixture quality differentiates across the market, see our breakdown in Best LED Grow Light Manufacturers in 2026.
Putting the Three Numbers Together: A Worked Example
Here is how a commercial lettuce producer would use PPFD, DLI, and efficacy together when sizing a system.
Target: 15 mol/m²/day DLI for a 100 m² lettuce production floor, 16-hour photoperiod.
Step 1 — Solve for required PPFD:
15 ÷ (16 × 0.0036) = 15 ÷ 0.0576 = 260 µmol/m²/s average at canopy
Step 2 — Size the fixture array:
Select fixtures with verified PPFD maps showing 250–280 µmol/m²/s average at your intended hanging height over the production area. Number of fixtures needed depends on the footprint each covers at that intensity.
Step 3 — Calculate operating cost using efficacy:
If total photon output required across 100 m² is 260 µmol/m²/s × 100 m² = 26,000 µmol/s total:
- At 2.5 µmol/J: requires 26,000 ÷ 2.5 = 10,400 watts of draw
- At 3.1 µmol/J: requires 26,000 ÷ 3.1 = 8,387 watts of draw
Over a 16-hour photoperiod, 365 days: that 2,013-watt difference is 11,756 kWh per year. At $0.12/kWh, that is $1,411 annually in electricity savings from efficacy alone — before factoring in HVAC load reduction from lower heat output.
That is the reason commercial operations care about efficacy. It is not a spec-sheet vanity metric. It is the number that determines how much margin survives the utility bill.
How to Use These Numbers in the AGL Directory
The AGL directory exists precisely because these three numbers are easy to game in marketing materials and hard to verify independently. Every listing in the directory is structured around verified, fixture-level specifications — not manufacturer marketing copy.
Here is how to put PPFD, DLI, and efficacy to work when you browse listings:
- Start with your crop’s DLI target. Use the tables above to identify the DLI range appropriate for your production goal. Back-calculate your required PPFD based on your intended photoperiod.
- Filter by efficacy floor. For commercial production in 2026, we recommend filtering to 2.9 µmol/J minimum. Below that threshold, you are carrying a meaningful operating cost penalty over a full crop cycle.
- Examine the PPFD map for the footprint size you actually need. A fixture that delivers 900 µmol/m²/s over a 3×3 foot area is not the same as one that delivers it over a 4×4 foot area. Normalize for your actual canopy footprint before comparing.
- Check whether specs are verified. AGL listings indicate where test data comes from — DLC certification, independent photometric labs, or manufacturer-supplied data. Weight your trust accordingly.
- Compare brands at the same power tier. A Gavita RS 2400e at 750 watts is not directly comparable to a ViparSpectra fixture at 200 watts. Sort and filter within the wattage range appropriate for your space before drawing conclusions.
The directory currently includes fixtures from HLG, Gavita, Fluence, Lumatek, Spider Farmer, ViparSpectra, and dozens of other manufacturers — with specs presented on a level field so the numbers do the talking, not the brand.
Frequently Asked Questions
What is the difference between PPFD and lux?
Lux measures light intensity as perceived by human eyes, weighted toward the green wavelengths we see most brightly. Plants respond to a broader range of wavelengths — red and blue in particular — that the lux scale undervalues. PPFD counts photons in the photosynthetically active range (400–700 nm) without weighting by human perception. For plant growth decisions, lux is functionally useless. PPFD is the correct unit.
Can I convert watts per square foot to PPFD?
Not without knowing fixture efficacy — which is exactly the problem with the watts-per-square-foot rule. A 600W fixture at 3.1 µmol/J produces 1,860 µmol/s total. A 600W fixture at 2.0 µmol/J produces 1,200 µmol/s total. Same wattage, 55% more photons from the efficient fixture. Watts-per-square-foot gives you no way to account for that difference.
What is a good DLI for a mixed indoor garden?
There is no single correct number for a mixed canopy, which is one reason mixed-crop rooms are operationally difficult to optimize. As a practical compromise, 18–22 mol/m²/day suits most fruiting herbs and moderate-light vegetables reasonably well, but high-light crops like tomatoes or flowering species will be underserved while low-light greens like lettuce risk tip burn at the high end. Purpose-built zones with separate light control is the commercial answer.
Does a higher efficacy fixture always produce better results?
Not necessarily — efficacy measures electrical efficiency, not spectrum quality, uniformity, or fixture build quality. A fixture at 3.2 µmol/J with a poorly designed spectrum or inadequate uniformity can underperform a well-designed 2.8 µmol/J fixture in terms of actual plant response. Efficacy is one of three critical numbers, not the only one. Use all three together.
How do I know if a manufacturer’s PPFD map is accurate?
Look for third-party verification. DLC (DesignLights Consortium) certification requires independent photometric testing — a DLC-listed fixture has had its output verified by a qualified lab. Manufacturer-produced maps should be treated as directionally useful but not independently confirmed. Some brands publish IES photometric files that third-party tools can audit. The AGL directory flags verification source on each listing.
What efficacy should I require from a grow light in 2026?
For commercial production, 2.9 µmol/J is a reasonable minimum threshold in 2026, with 3.0+ being the target for operations where electricity represents a meaningful cost center. The leading commercial fixtures — including the Gavita RS 2400e at 3.2 µmol/J and the Fluence SPYDR 3 at 3.0 µmol/J — represent current best-in-class. The Lumatek ZEUS 600W PRO at 2.85 µmol/J is a strong mid-market option. Below 2.5 µmol/J, the operating cost penalty compounds significantly over a full production year.
Is DLI the same as cumulative PPFD?
Conceptually yes — DLI is the integral of PPFD over a full day, which is why it is called the Daily Light Integral. The calculation converts the instantaneous µmol/m²/s reading into a daily total by multiplying by the photoperiod in seconds and dividing by one million to convert micromoles to moles. The result — mol/m²/day — gives you the total photon dose the canopy received, which is a more meaningful predictor of plant growth response than any single PPFD snapshot.
My fixture doesn’t list efficacy in µmol/J — what do I do?
If the manufacturer only publishes wattage and total PPF output (µmol/s), you can calculate efficacy yourself: divide PPF by wattage. A fixture delivering 1,800 µmol/s at 600 watts has an efficacy of 3.0 µmol/J. If the manufacturer provides neither PPF nor efficacy — only wattage — that is itself a signal worth noting. Professional-grade fixtures designed for commercial use publish these numbers because their commercial customers demand them.
The AGL directory lists verified professional horticultural grow lights with efficacy, PPF, and PPFD map data presented on a consistent, brand-neutral basis. If you are evaluating fixtures for a commercial build or a serious indoor operation, the directory is the fastest way to compare real specs across the market without wading through marketing copy.
What is the difference between PPFD and lux?
Lux measures light intensity as perceived by human eyes, weighted toward the green wavelengths we see most brightly. Plants respond to a broader range of wavelengths — red and blue in particular — that the lux scale undervalues. PPFD counts photons in the photosynthetically active range (400–700 nm) without weighting by human perception. For plant growth decisions, lux is functionally useless. PPFD is the correct unit.
Can I convert watts per square foot to PPFD?
Not without knowing fixture efficacy — which is exactly the problem with the watts-per-square-foot rule. A 600W fixture at 3.1 µmol/J produces 1,860 µmol/s total. A 600W fixture at 2.0 µmol/J produces 1,200 µmol/s total. Same wattage, 55% more photons from the efficient fixture. Watts-per-square-foot gives you no way to account for that difference.
What is a good DLI for a mixed indoor garden?
There is no single correct number for a mixed canopy, which is one reason mixed-crop rooms are operationally difficult to optimize. As a practical compromise, 18–22 mol/m²/day suits most fruiting herbs and moderate-light vegetables reasonably well, but high-light crops like tomatoes or flowering species will be underserved while low-light greens like lettuce risk tip burn at the high end. Purpose-built zones with separate light control is the commercial answer.
Does a higher efficacy fixture always produce better results?
Not necessarily — efficacy measures electrical efficiency, not spectrum quality, uniformity, or fixture build quality. A fixture at 3.2 µmol/J with a poorly designed spectrum or inadequate uniformity can underperform a well-designed 2.8 µmol/J fixture in terms of actual plant response. Efficacy is one of three critical numbers, not the only one. Use all three together.
How do I know if a manufacturer’s PPFD map is accurate?
Look for third-party verification. DLC (DesignLights Consortium) certification requires independent photometric testing — a DLC-listed fixture has had its output verified by a qualified lab. Manufacturer-produced maps should be treated as directionally useful but not independently confirmed. Some brands publish IES photometric files that third-party tools can audit. The AGL directory flags verification source on each listing.
What efficacy should I require from a grow light in 2026?
For commercial production, 2.9 µmol/J is a reasonable minimum threshold in 2026, with 3.0+ being the target for operations where electricity represents a meaningful cost center. The leading commercial fixtures — including the Gavita RS 2400e at 3.2 µmol/J and the Fluence SPYDR 3 at 3.0 µmol/J — represent current best-in-class. The Lumatek ZEUS 600W PRO at 2.85 µmol/J is a strong mid-market option. Below 2.5 µmol/J, the operating cost penalty compounds significantly over a full production year.
Is DLI the same as cumulative PPFD?
Conceptually yes — DLI is the integral of PPFD over a full day, which is why it is called the Daily Light Integral. The calculation converts the instantaneous µmol/m²/s reading into a daily total by multiplying by the photoperiod in seconds and dividing by one million to convert micromoles to moles. The result — mol/m²/day — gives you the total photon dose the canopy received, which is a more meaningful predictor of plant growth response than any single PPFD snapshot.
My fixture doesn’t list efficacy in µmol/J — what do I do?
If the manufacturer only publishes wattage and total PPF output (µmol/s), you can calculate efficacy yourself: divide PPF by wattage. A fixture delivering 1,800 µmol/s at 600 watts has an efficacy of 3.0 µmol/J. If the manufacturer provides neither PPF nor efficacy — only wattage — that is itself a signal worth noting. Professional-grade fixtures designed for commercial use publish these numbers because their commercial customers demand them.