BLOG POST
Why Your PAR Meter Might Understate Your Grow Light by 25% or More
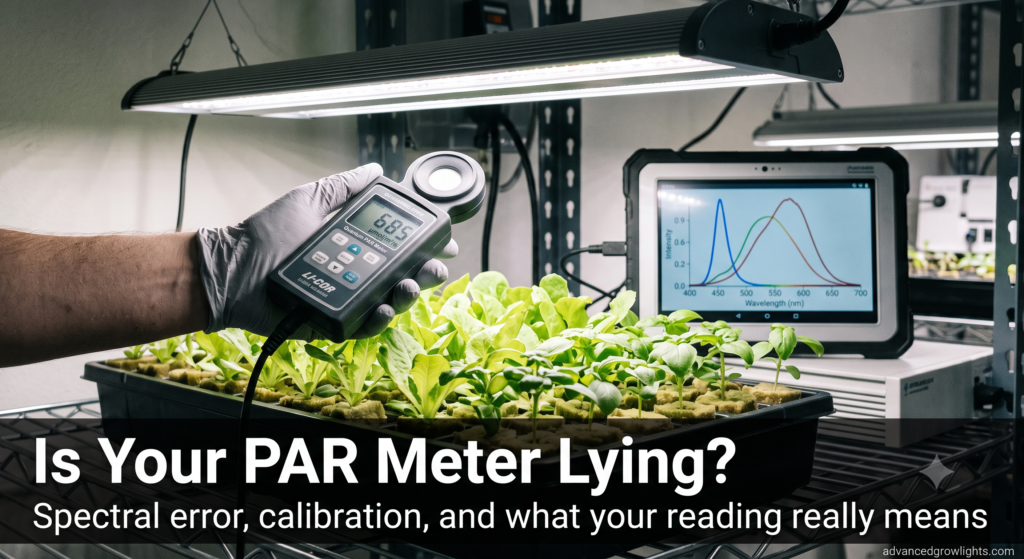
A grower buys a fixture rated at 1,200 µmol/m²/s PPFD, sets it at the manufacturer’s recommended hanging height, points a PAR meter at the canopy, and reads 890. The fixture isn’t underperforming. The meter is.
Commercial growers verify light output constantly, before buying a fixture, after installation, and during periodic uniformity checks across a canopy. Every one of those checks assumes the meter in hand reports a true number. AGL’s guide to PPFD, DLI, and efficacy covers what those numbers mean once measured correctly. This piece covers the part that comes before that: whether the reading on the meter’s display reflects the light hitting the canopy, or a wavelength-dependent approximation with a built-in blind spot.
What a Quantum Sensor Measures
A quantum sensor is supposed to count photons equally across the 400 to 700 nanometer PAR band, the “ideal quantum response” every PPFD meter targets. No silicon photodiode achieves that in practice. Real sensors respond more strongly to some wavelengths than others, and manufacturers apply a correction curve to compensate. That correction is calibrated against one specific light source, and it only cancels out perfectly when the light being measured matches the light used for calibration.
Apogee Instruments, one of the two most widely used quantum sensor manufacturers alongside LI-COR, calibrates different models against different references. The SQ-110 calibrates against clear-sky sunlight. The SQ-120 and SQ-500 calibrate against 4100K cool white fluorescent lamps. Point an SQ-120 at clear-sky sunlight instead of the fluorescent source it was built for, and Apogee’s own published figures show a spectral error of -13.9%, requiring a correction factor of 1.16 to recover an accurate reading. That gap exists between two broadband sources. Point the same sensor at a narrow-band LED array, and the mismatch gets worse.
The Deep Red Blind Spot
LED grow lights push a disproportionate share of their photon output into the deep red band between 660 and 700 nanometers, a region chlorophyll absorbs efficiently and manufacturers tune for deliberately. Many affordable quantum sensors respond weakly right where that output concentrates.
Black Dog LED documented the effect directly using Apogee’s own published spectral error calculation method. The company’s PhytoMAX fixtures emit roughly 25% of their total photon output above 660 nanometers. Apogee’s standard quantum sensors detect almost none of that range. Running the numbers through Apogee’s error-estimation spreadsheet, Black Dog calculated a 25.9% understatement for PhytoMAX spectra measured on a standard Apogee sensor, meaning a grower needs to multiply the meter’s reading by roughly 1.259 to recover the true PPFD. Sun Systems meters, built on the same underlying Apogee sensor technology, carry the identical blind spot.
Worked example: what a 26% error costs you
Take a fixture rated at 1,200 µmol/m²/s at the manufacturer’s test height. A grower hangs it at that height, measures 890 with an uncorrected sensor mismatched to a deep-red-heavy spectrum, and assumes the fixture falls 26% short of spec. Applying the correction factor Black Dog documented, 890 × 1.259 lands at roughly 1,121, within a reasonable margin of the rated 1,200 once mounting height and beam angle variance enter the picture. The fixture was never the problem. Two outcomes follow from that gap depending on which number a grower trusts: a wasted warranty claim over a fixture that’s performing as designed, or an unnecessary decision to add supplemental fixtures the room never needed in the first place.
Apogee vs. LI-COR: Where They Agree and Where They Don’t
Apogee’s SQ-500 and LI-COR’s LI-190R, the two research-grade quantum sensors most commercial growers encounter, carry identical 5% calibration uncertainty and near-identical directional response, holding under 2% angular error out to a 60-degree zenith angle. Across a broad set of tested light sources, both stayed under 4% spectral error overall. The divergence shows up wavelength by wavelength. Apogee measured a 635nm red LED at 0.8% error against LI-COR’s 3.6% on that same source. LI-COR came back stronger on a 667nm red LED, at 0.9% versus Apogee’s 2.8%. Neither sensor wins across the board. The practical lesson isn’t that one brand outperforms the other. It’s that any single-photodiode quantum sensor carries wavelength-specific blind spots that shift depending on exactly where in the spectrum a given fixture concentrates its output.
A published spectral power distribution chart turns that uncertainty into a calculation instead of a guess. Manufacturers who publish full SPD data alongside PPFD and PPE numbers give growers the one input Apogee’s error-estimation tool requires: the wavelength-by-wavelength breakdown of what the fixture emits. A spec sheet listing only a single PPFD number, with no SPD chart behind it, leaves a grower with no way to predict how far a given meter’s reading will drift from that number. Treat the absence of published SPD data as a gap worth asking about before a purchase, before any warranty dispute forces the question.
| Sensor / Method | Calibration Reference | Typical Error (Matched Source) | Known Weak Point |
|---|---|---|---|
| Apogee SQ-110 | Clear-sky sunlight | Under 4% on matched sources | Significant error under non-sunlight sources without correction |
| Apogee SQ-120 / SQ-500 | 4100K cool white fluorescent | Under 4% on matched sources; -13.9% measured under sunlight | Deep red (660–700nm) underreading on red-rich LED spectra |
| LI-COR LI-190R | Broadband reference source | Under 4% on tested sources | Comparable red-wavelength divergence, different error profile than Apogee |
| Spectroradiometer (integrated PPFD) | None needed; measures full spectrum directly | ±4.2% (k=2) with proper calibration | Higher cost, less practical for routine canopy spot-checks |
Why DLC-Listed Specs Don’t Carry the Same Error
The PPE and PPFD numbers on a DLC-listed fixture’s official spec sheet come from a different measurement chain than a handheld quantum sensor in a grow room. DLC’s Horticultural QPL testing methodology requires photometric data under ANSI/IES LM-79, a lab protocol that measures total luminous and photon flux using integrating spheres and goniophotometers rather than a single point sensor. That process captures the full spectral output directly, the same way a spectroradiometer does in the field, and it sidesteps the calibration-mismatch problem entirely because it isn’t approximating a response curve against one reference source.
That gap explains why a grower’s field measurement can diverge meaningfully from the number on a verified spec sheet without either number being wrong. The lab number describes total photon output measured with lab-grade equipment built to eliminate spectral mismatch. The field number describes a point measurement at canopy height using a handheld sensor calibrated to a different light source. Both are real. They answer different questions, and confusing them leads to exactly the kind of false underperformance conclusion described above.
How to Trust a PPFD Reading
Start by identifying the calibration source behind whatever sensor is in hand. A meter calibrated to sunlight or cool white fluorescent and pointed at a deep-red-heavy LED array needs a correction factor before the number means anything. Apogee publishes a spectral error estimation tool that calculates that factor for a given sensor and light source combination, and any fixture manufacturer publishing full spectral power distribution data lets a grower run that calculation directly instead of guessing.
Placement matters as much as calibration. A single point reading directly under a fixture’s center tells you nothing about uniformity across the canopy, and a sensor tilted even slightly off the horizontal introduces cosine error on top of any spectral mismatch already present. Build a measurement grid instead: divide the canopy into a 3×3 or 4×4 array of points at consistent height, log each reading, and average across the grid rather than trusting one spot check. A single low reading near the edge of a fixture’s beam angle reflects normal fall-off, not a defective unit, and a grid catches that pattern where one point measurement can’t.
Consistency across repeat measurements matters more than any single reading’s absolute precision. If a facility tracks PPFD monthly with the same sensor at the same grid points and height, a real decline in output shows up as a trend the spectral error can’t hide, since that error stays roughly constant across measurements taken with the same equipment under the same spectrum. A sudden drop against that trend is a meaningful signal. A one-time reading that falls short of a spec sheet number, on its own, is not.
A spectroradiometer sidesteps the whole problem by integrating photon flux across the full 400–700nm range directly, rather than relying on a single photodiode’s approximated response curve, and it holds accuracy to roughly ±4.2% regardless of source spectrum. That precision comes at a cost and a learning curve most growers reserve for R&D benches, DLC submission testing, or resolving a genuine dispute over fixture performance, not routine canopy checks.
Two practical habits close most of the gap without new equipment. Never compare a raw reading from one meter brand against a spec sheet number generated by a different measurement method without checking both sensors’ calibration source first. And when a reading comes in meaningfully below spec on a fixture with a documented deep-red-heavy spectrum, check the sensor’s known weak points before assuming the fixture underperforms.
Frequently Asked Questions
Why does my PAR meter read lower than my grow light’s rated PPFD?
Most affordable quantum sensors are calibrated against sunlight or fluorescent light, not the narrow-band spectrum an LED grow light emits. If the fixture concentrates output in the deep red band above 660nm, a mismatched sensor can undercount that light and report a PPFD well below the fixture’s actual output.
What is spectral error in a quantum sensor?
Spectral error is the gap between a sensor’s actual response and the ideal quantum response, an equal response to every wavelength between 400 and 700 nanometers. It depends on the sensor’s response curve, the light source used to calibrate it, and the light source being measured.
How much can a PAR meter understate an LED grow light?
Documented cases show understatement of roughly 26% for red-heavy LED spectra measured on standard Apogee-based sensors, according to Apogee’s own spectral error calculation method applied to a real fixture’s spectral power distribution.
Is Apogee or LI-COR more accurate for grow light measurement?
Neither wins consistently. Both hold under 4% spectral error across most tested light sources, but each shows different error rates at specific red wavelengths. The choice matters less than knowing the calibration source behind whichever sensor gets used.
Do I need a spectroradiometer to measure my grow light accurately?
Not for routine checks. A spectroradiometer integrates the full spectrum directly and avoids spectral mismatch error entirely, holding roughly ±4.2% accuracy regardless of source. That precision matters for certification testing or resolving a real dispute, less so for a weekly canopy spot-check with a correction factor already applied.
How do I calculate the correction factor for my sensor and fixture?
Apogee publishes a spectral error estimation tool that calculates the expected error and correction factor for a given sensor model against a specified light source’s spectral power distribution. It requires the fixture manufacturer’s published spectral data to run.
Should I trust a low PPFD reading enough to file a warranty claim?
Check the sensor’s calibration source and the fixture’s spectral distribution before assuming the fixture is defective. A documented spectral mismatch, not a failing fixture, explains many low readings on deep-red-heavy LED arrays.
Compare verified specs, including published spectral data where available, across brands in AGL’s grow light directory.