
BLOG POST
Grow Light Uniformity: Why Average PPFD Hides a Patchy Canopy
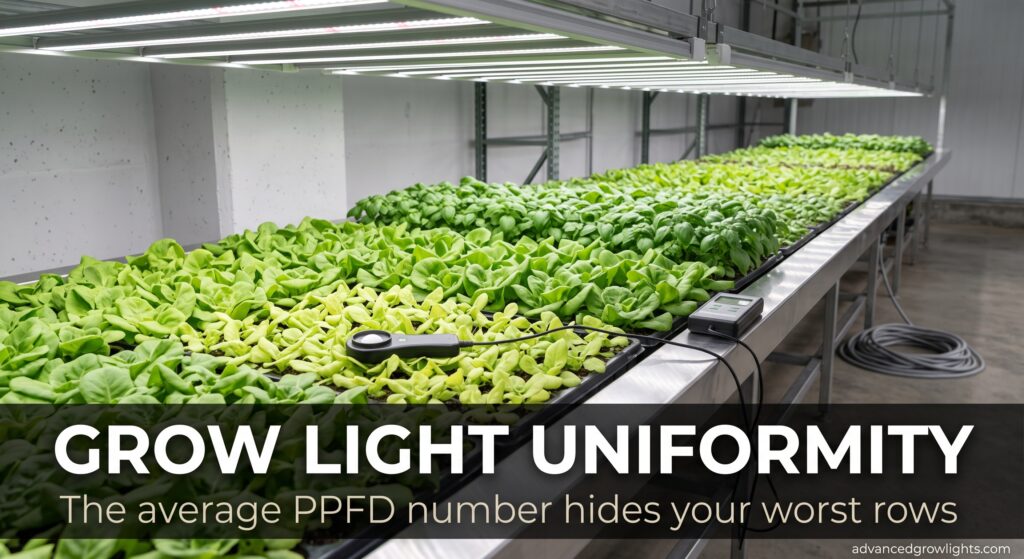
Your grow light spec sheet lists one PPFD number. Your canopy holds a few hundred of them. That gap is where yield goes missing.
Growers told Greenhouse Management magazine’s 2026 Lighting Market Report survey that LED use across greenhouse operations now sits near three-quarters, down about 10 points from the 2025 survey, and fewer than half rate their crop-quality gains or their chosen brand as satisfactory. Some of that lukewarm response traces to the fixtures. More of it traces to the layout.
The DesignLights Consortium tightened its Horticultural Technical Requirements to Version 4.0, and as of July 1, 2026 most utilities require a V4.0 listing before they pay a rebate. V4.0 raised the photon efficacy floor to a minimum of 2.5 µmol per joule, up from 2.3 in V3.0, and it tests a fixture on a lab bench. It tells you nothing about the light 30 inches below that fixture, spread across a real bench, competing with the fixture hung next to it. You can buy the most efficient light on the qualified products list and still light half your plants wrong.
Three ways to measure uniformity
Light uniformity describes how even the spread of photon flux is across a growing area. Lighting designers report it three ways.
- Minimum-to-average (min/avg): the lowest PPFD reading on your grid divided by the average of all readings. This tracks how far the weakest spot sits below the mean.
- Minimum-to-maximum (min/max): the lowest reading divided by the highest. This shows the full spread between your best and worst position.
- Coefficient of variation (CV): the standard deviation of all readings divided by the mean, given as a percent. Lower is tighter. Researchers favor this one.
Take a bench that reads 720 µmol/m²/s under the center of the fixture and 300 in a back corner, with a 25-point grid averaging 560. The min/avg comes out to 0.54. The min/max lands at 0.42. Both numbers say the same thing in different words. Your corner plants live on about 40 percent of the light your center plants receive, every hour of every day of the cycle.
The average hides the problem
A plant responds to the photons landing on its own leaves, not to the bench average. Convert those two corner-versus-center readings into daily light integral at a 12-hour photoperiod and the picture sharpens. The average 560 µmol delivers 24.2 mol/m²/day. The 300 µmol corner delivers 13.0. On a single bench you have plants getting a flowering-crop dose and plants getting a leafy-greens dose.
The underlit plants stretch for light, run thinner stems, and finish late. The overlit center can bleach or show light stress. You paid for one crop and grew three. The average PPFD on the invoice looked fine the whole time.
Two benches can post the same average and behave nothing alike.
| Metric | Bench A (tight layout) | Bench B (loose layout) |
|---|---|---|
| Average PPFD (µmol/m²/s) | 600 | 600 |
| Minimum PPFD | 540 | 320 |
| Maximum PPFD | 660 | 890 |
| min/avg ratio | 0.90 | 0.53 |
| min/max ratio | 0.82 | 0.36 |
| Edge-row DLI at 12 h (mol/m²/day) | 23.3 | 13.8 |
| Practical result | Even harvest, one finish date | Edge rows lag and stretch, center risks bleaching |
Bench B is not a lighting failure on paper. It hits its target average. It fails in the room.
Crop value sets your uniformity target
Not every crop needs the same floor. Propagation and young transplants run at low PPFD, 100 to 200 µmol, and a min/avg of 0.7 costs you little because the whole tray sits well below saturation. Leafy greens at 200 to 350 µmol tolerate a 0.75 floor, with one catch: head weight tracks light, so a loose canopy shows up as a wider grade spread at harvest and more trim loss.
Fruiting crops and high-value flower at 600 to 1,000 µmol punish a weak floor. A plant held 200 µmol under its neighbors across an eight-week flower runs a visible size and quality gap, and buyers pay by grade. For those rooms a min/avg of 0.85 or better earns its keep. Set the target before you shop, because it decides how much fixture and how tight a layout you need.
Spatial uniformity and temporal uniformity are different questions
Spatial uniformity asks whether every position on the bench gets the same light. Temporal uniformity asks whether one position gets steady light over time. Chasing a perfect spatial grid wastes money, and research on the temporal side explains part of the reason.
Bhuiyan and van Iersel at the University of Georgia grew lettuce under sole-source LEDs while swinging the light between a high and a low value on a 30-minute cycle (Frontiers in Plant Science, 2021). Splits from 320/80 down to 200/200 µmol produced plants with matching dry mass, leaf area, and chlorophyll. The extreme splits, 400/0 and 360/40, cut dry mass by up to 90 percent. Plants buffered moderate differences and broke under large ones.
That study varied light over time, not position, so the numbers do not transfer one to one. The lesson does. Lift the underlit floor of your canopy toward the average. Do not spend a second fixture flattening a peak that the plants already tolerate.
Reading past a manufacturer PPFD map
The industry does have measurement standards. ANSI/ASABE S640 fixed the vocabulary, PPFD, photon flux, and the waveband definitions, and ANSI/ASABE S642 set the lab test methods, building on the LM-79 procedure for electrical and photometric testing. Both operate at the fixture level. No standard defines an installed-canopy uniformity result, so the PPFD map in a sales deck is a marketing document, not a test report. Four things go wrong with it.
- One fixture, not your array. A single-fixture map misses the overlap you gain from neighboring fixtures and the falloff you suffer at the room perimeter.
- A flattering mounting height. Raise a fixture and the map smooths out. The height on the map may not match the height your crop needs.
- A mapped area smaller than the real footprint. Crop the map to the bright center and the edge dropoff never appears.
- No minimum or maximum. Most maps print one number and leave off the range, which is where the uniformity story lives.
Tharindu Weeraratne of Fluence Bioengineering made the practical point back in 2017: ask the vendor for minimum and maximum PPFD, or for an isoline map or false-color plot, because two fixtures with the same average can put the light in different places. He listed the variables that move the result: fixture output, distance to canopy, beam angle, angle of incidence, and canopy area.
An example. Fixture X publishes a map at 24 inches over a 4-by-4-foot area: average 780, and the deck stops there. Fixture Y publishes at 12 inches over the same area: average 620, minimum 470, maximum 810, min/avg 0.76. Fixture X reads stronger on the headline. You have no idea what its corners do, and 24 inches may sit higher than your tent or your rack allows. Fixture Y gave you the whole range and let you plan around it. The fixture with the worse-looking number is the one you can design with.
Before you sign a purchase order, ask each vendor for a full-bench PPFD map at your mounting height, your bench dimensions, and your fixture count and spacing, with minimum, average, maximum, and min/avg all stated. A vendor who will not produce that is telling you something.
The three levers that fix a patchy canopy
Mounting height
Height trades intensity against spread. Raise the fixture and the beams overlap into a smoother field at lower PPFD. Drop it and PPFD climbs while hotspots and dark bands sharpen. Fixture makers publish working ranges that vary by form factor.
| Fixture type | Typical mounting height above canopy |
|---|---|
| Slim single-bar LED | 6 to 14 inches |
| Wide linear multi-bar | 10 to 18 inches |
| High-power multi-row assembly | 14 to 24 inches |
| Vertical rack fixture | 6 to 10 inches, airflow permitting |
Treat these as starting points and confirm against your own map. One thing height does not do is trade against dimming. Dimming a fixture scales every point on its map by the same fraction, so a layout that is patchy at full power stays patchy at 60 percent. Dimming sets intensity, not uniformity.
Fixture and bar spacing
Fixtures set farther apart produce smoother PPFD curves because their beams cross and blend. Clustered bars stack into intensity ridges with dark gutters between them. General lighting design offers a rule of thumb worth testing: keep fixture-to-fixture spacing close to the mounting height above the canopy. A fixture 18 inches over the crop wants its neighbor about 18 inches away, center to center. Run that against the vendor’s layout tool for your specific fixture before you hang anything.
The perimeter
Edge falloff is the largest uniformity loss in most rooms. Three fixes stack well. Hang the outer fixtures past the last row of plants, not centered over it, so the beam edge lands beyond the canopy. Tighten the spacing of the perimeter fixtures, or add a half fixture along the wall. Paint the walls flat white, which returns edge photons at a reflectance near 0.8, and clear dark equipment and black-out cloth out of the light path where you can.
Uniformity and the power bill
The wrong reaction to a patchy map is to turn everything up. Push the room from a 600 µmol average to 750 to drag the corners onto target and you have added 25 percent to your lighting energy to paper over a layout problem. The 2026 electricity math already runs against you, with summer commercial rates above 20 cents per kilowatt-hour in several markets and demand charges on top. Lifting the underlit floor with height and spacing changes costs a ladder and an afternoon. Cranking power to hide the same gap shows up on every invoice for the life of the room. Fix the distribution, then set the intensity.
Form factor and the fixtures in the directory
Bar-style and rack fixtures spread their emitters across the whole footprint, which holds uniformity together at low mounting heights and suits vertical racks and wide benches. A Gavita RS 2400e (3.2 µmol/J, 750 W) and a Fluence SPYDR 3 (3.0 µmol/J, 800 W) are both multi-bar designs built for even coverage close to the canopy. Compact plate and puck fixtures concentrate output through a smaller aperture and need more height or tighter spacing to even out.
For tall crops, no top layer alone keeps the lower canopy lit. Schipper and colleagues modeled a greenhouse tomato crop and found that an even split between top light and intra-canopy strings cut the vertical coefficient of variation to 51 percent, against 69 percent for top light alone (Frontiers in Plant Science, 2023). That is the case for interlighting inside the canopy rather than more wattage overhead.
The AGL directory lists photon efficacy and input power for each fixture from manufacturer documentation. Use that to shortlist, then get a PPFD map from each vendor at your parameters. Efficacy tells you the running cost. The map tells you whether every plant gets paid.
Run your own uniformity audit
You need a quantum sensor, a tape measure, and 20 minutes. A PAR meter with spectral correction reads closer to the truth under narrow-band LEDs, an error this breakdown of quantum sensor accuracy covers in full.
- Mark a grid across the bench. One-foot spacing works for most rooms. Move to two feet for large ranges, and add points along edges and corners where the dropoff is sharpest.
- Warm the fixtures at full power for 15 to 30 minutes.
- Hold the sensor flat at canopy height at each grid point, at the same time in the photoperiod, and record every reading.
- Compute the average, minimum, and maximum. Divide to get min/avg and min/max.
- Drop the readings into a spreadsheet and shade the cells to sketch an isoline map by eye.
Map the light with the crop in place at working height, not over an empty bench. Light distribution is half the equation and the canopy is the other half. Plants spaced too wide leave gaps that read as bright floor on a sensor and add nothing to yield. A canopy trained flat, with even plant spacing and leaf area, uses a uniform field. A ragged canopy wastes a good one. Re-check the map after you prune, defoliate, or move plants.
Greenhouse growers can run a lighter version of this. Diffuse daylight fills most of the gaps, so the supplemental map matters most on dark winter days when the LEDs carry the daily light integral. Map on an overcast morning with the supplemental fixtures on, and you see your worst-case day.
A worked case. A 4-by-8-foot bench, one-foot grid, 45 points. Average 612 µmol/m²/s, minimum 358 in the back-left corner, maximum 780 near center. That is min/avg 0.58 and min/max 0.46. At a 12-hour photoperiod the corner runs 15.5 mol/day against the bench average of 26.4, a shortfall of almost 11 mol on the plants that already sit in the coldest, draftiest part of the room.
The fix took two moves. Slide the left-hand bar 8 inches out past the bench edge. Lower the whole rack 2 inches. The second map returned min/avg 0.82 and min/max 0.71, with no change to the fixtures or the power bill. The corner plants gained about 6 mol/day.
Grid your benches once a year and after any layout change. For the fundamentals behind these numbers, see PPFD, DLI, and efficacy explained.
A checklist before you buy
- Set a min/avg target from your crop and PPFD range before you compare fixtures.
- Ask every vendor for a full-bench PPFD map at your mounting height, bench size, and fixture spacing.
- Require minimum, average, and maximum on that map, not the average alone.
- Check that the mapped area matches your real footprint and the height fits your room.
- Plan the perimeter first: outer fixtures past the last row, tighter edge spacing, white walls.
- Grid your own benches after install, once a year, and after any layout change.
The bottom line
A single PPFD figure is an average with the interesting part removed. Ask for the minimum and the maximum, map your own benches, lift the underlit floor, and stop worrying about peaks your crop already handles. The fixture on the qualified products list is a good start. The layout is what grows the crop.
What uniformity ratio should I aim for?
A min/avg at or above 0.8 and a min/max at or above 0.7 cover most commercial benches. Propagation and leafy greens tolerate less. High-value flower rewards 0.85 and up. No published standard sets a hard figure, so treat these as targets from lighting practice.
Does a more uniform fixture let me hang lights lower?
Yes. Even distribution means fewer hotspots to burn, so you can drop mounting height for more PPFD without scorching the bright spots.
How many measurement points do I need for a uniformity map?
A one-foot grid across the bench covers most rooms. Add points along the edges and in the corners, where light falls off fastest.
My canopy varies by 15 percent. Is that a problem?
In most cases, no. The University of Georgia lettuce work found plants absorb moderate swings in light with no yield hit. Spend your effort raising the underlit floor, not flattening every ripple.
Are manufacturer PPFD maps trustworthy?
They are not wrong, they are incomplete. Most show one fixture at a favorable height over a small area with the average printed and nothing else. Ask for a full-bench map at your parameters with minimum, average, and maximum.
Does uniformity matter in a greenhouse with sunlight?
Less than in a windowless room, because daylight fills the gaps. It still matters on dark winter days, when supplemental LEDs supply most of the daily light integral.