BLOG POST
Monochromatic LEDs Cut Iron and Zinc in Greens by Up to 70%, New Research Shows
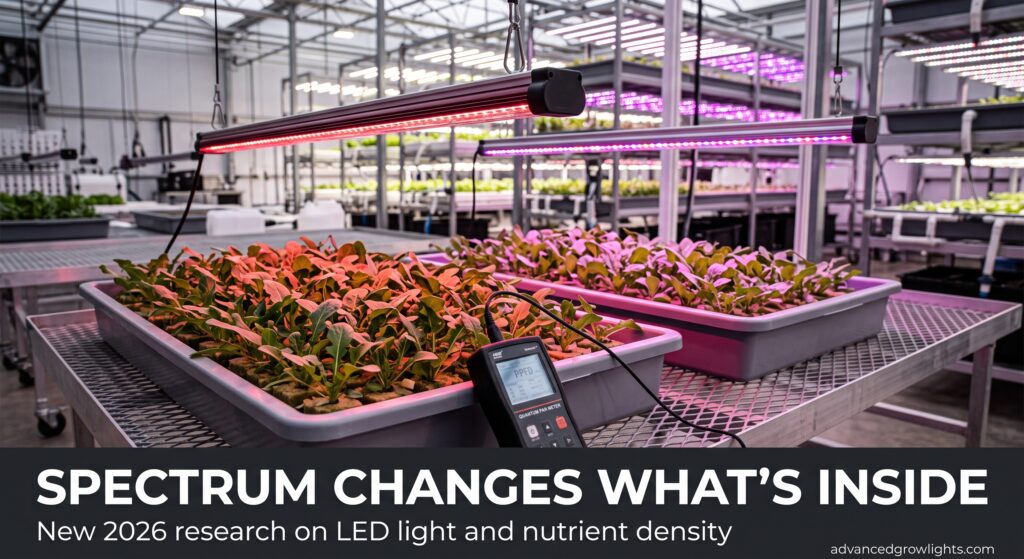
Lithuania’s national agricultural research center published a study in May 2026 that should worry anyone marketing “nutrient-dense” leafy greens grown under a single-color LED bar. Researchers at the Lithuanian Research Centre for Agriculture and Forestry grew shungiku, the edible chrysanthemum used in East Asian cooking, under red-only, blue-only, and combined red-blue light. Iron and zinc content in the crop swung by as much as 70 percent depending on which recipe they used. Biomass moved too, but the mineral swing is the sharper number, and it lands in a corner of CEA lighting research that gets far less attention than yield.
Most spectrum research chases grams per square meter or micromoles of photosynthetic photon flux. Akvilė Viršilė and four coauthors instead tracked what monochromatic light does to a crop’s mineral load, and their numbers give growers running cheap red or blue-heavy fixtures a reason to check a spectrum sheet before they promise a customer extra iron.
Inside the Study Design
The team ran three parallel hydroponic experiments on shungiku under controlled conditions. The first compared monochromatic red light (660 nm), monochromatic blue light (447 nm), and a combined red-blue treatment. The second held daily light integral constant while varying photoperiod across 12, 16, and 24 hours. The third fixed the photoperiod at 16 hours and stepped photosynthetic photon flux density through 150, 200, 250, and 300 µmol m⁻² s⁻¹. Three biological replications backed each measurement, and the team ran one-way ANOVA with Tukey’s test to confirm which differences held up.
Nobody tested a broad-spectrum white LED in this study. That gap matters for the rest of this article: the data compares monochromatic light against a red-blue mix, not against the full-spectrum white fixtures that dominate a lot of commercial CEA racks today. Treat the findings as evidence about narrow-band spectra, not as a verdict on white LEDs.
Monochromatic Light Cuts Iron and Zinc
Both red-only and blue-only light produced plants with far less iron and zinc than the combined red-blue treatment. Leaves grown under monochromatic light carried 34 to 70 percent less iron and 40 to 50 percent less zinc than leaves grown under red-blue light. Red-only light alone dropped calcium 13 percent, and blue-only light alone dropped manganese 17 percent. Iron and zinc content moved together across treatments, with a correlation coefficient of 0.92, and both minerals tracked leaf area, dry weight, and soluble sugar content in the same direction.
Viršilė’s team reads that correlation with care. Fe and Zn declines lined up with drops in biomass and sugar accumulation, which points to a shared metabolic response rather than blue or red photons blocking mineral uptake on their own. Roots pull iron and zinc from a nutrient solution using energy from photosynthesis, so a spectrum that limits carbon fixation may limit mineral uptake as a side effect rather than a separate, direct block. Growers should read the finding as evidence that monochromatic light stunts the whole plant, minerals included, rather than evidence that red photons block iron by themselves.
Growth followed the same pattern. Leaf area under red light measured 50 percent smaller than under red-blue light, and blue-only leaf area measured 22 percent smaller. Dry weight dropped 41 percent under red-only and 17 percent under blue-only light compared to the combined treatment.
The Antioxidant Trade-Off
Red light did not lose on every measure. Chrysanthemum leaves grown under monochromatic red and blue light carried 90 percent and 81 percent more total phenolic compounds than leaves grown under red-blue light. Red light cost the plant on antioxidant activity: DPPH and ABTS free radical scavenging activity dropped 44 and 23 percent under red-only light, and FRAP antioxidant power dropped 21 percent, compared to red-blue. Blue-only light held antioxidant activity level with red-blue.
A grower running a red-only bar over shungiku is not producing a nutritionally empty crop. That grower is producing a crop lower in iron, zinc, calcium, and biomass, but higher in phenolic compounds, with antioxidant capacity that depends on the monochromatic wavelength chosen. There is no single best spectrum here. There is a trade-off between mineral density and phenolic density, and a grower marketing “high in antioxidants” needs a different fixture recipe than one marketing “high in iron.”
Photoperiod and Intensity Move Growth Too
The photoperiod experiment held daily light integral constant and varied only the hours the lights ran. A 12-hour photoperiod produced 53 percent more leaf area and 46 and 35 percent more fresh and dry weight than a 16-hour photoperiod at the same total daily photon count. Twenty-four hours gave no advantage over 16. For a crop grown at fixed DLI, a shorter photoperiod at higher instantaneous intensity beat a longer photoperiod spreading the same photon budget across more hours.
The intensity experiment used 250 µmol m⁻² s⁻¹ as its reference point at a fixed 16-hour photoperiod. Dropping to 150 µmol m⁻² s⁻¹ cost the plant 20 percent leaf area and 20 to 27 percent fresh and dry weight. Pushing to 300 µmol m⁻² s⁻¹ increased biomass, soluble sugars, antioxidant capacity, organic acids, and micronutrient content further, but light use efficiency peaked at 200 µmol m⁻² s⁻¹, not at 300. Maximum yield and maximum photon efficiency landed on different setpoints.
A Worked Example: Chasing Yield Costs More Photons Than Chasing Efficiency
Daily light integral, DLI, equals photosynthetic photon flux density multiplied by photoperiod in seconds, divided by one million. At the study’s fixed 16-hour photoperiod, the two intensity setpoints work out to:
- 200 µmol m⁻² s⁻¹ × 16 hours × 3,600 seconds ÷ 1,000,000 = 11.52 mol m⁻² day⁻¹ (peak light use efficiency)
- 300 µmol m⁻² s⁻¹ × 16 hours × 3,600 seconds ÷ 1,000,000 = 17.28 mol m⁻² day⁻¹ (peak yield)
Running the higher setpoint costs 5.76 additional mol m⁻² day⁻¹, 50 percent more daily photons, for a yield gain the study calls real but incremental once light use efficiency has already peaked. A grower pricing a shungiku or similar leafy-green rack against a per-kWh electricity rate now has a number to weigh: does the extra biomass from that additional 50 percent of photons justify the added electricity draw, or does the 200 µmol m⁻² s⁻¹ setpoint capture most of the value at two-thirds of the energy cost? DLC-listed fixtures publish photosynthetic photon efficacy in µmol/J so growers can run this math against their own utility rate instead of guessing.
Spectrum Effects at a Glance
All percentages below compare the named treatment against the combined red-blue (RB) treatment, the strongest performer on growth and mineral content in this study.
| Measurement | Red-only (660 nm) vs. RB | Blue-only (447 nm) vs. RB |
|---|---|---|
| Leaf area | 50% lower | 22% lower |
| Dry weight | 41% lower | 17% lower |
| Iron content | 34-70% lower | 34-70% lower |
| Zinc content | 40-50% lower | 40-50% lower |
| Calcium content | 13% lower | No significant difference |
| Manganese content | No significant difference | 17% lower |
| Total phenolic compounds | 90% higher | 81% higher |
| DPPH / ABTS antioxidant activity | 44% / 23% lower | No significant difference |
Source: Viršilė et al., Plants 2026, 15(9), 1394.
The Finding Isn’t Unique to One Crop
Shungiku is not a common CEA crop in the United States, and a skeptical grower could dismiss a single-species result. Older research on more familiar crops points in the same direction, even though none of it measured iron and zinc with the precision of the 2026 study.
A 2019 study in the same journal ran lettuce, spinach, kale, basil, and sweet pepper under red-to-blue ratios from 100 percent red down to 83 percent red plus 17 percent blue. Every crop responded to added blue light, each in its own way. Lettuce fresh mass rose 1.2 times, kale rose 2.2 times, and pepper fruit production rose 4.6 times when researchers added even a small blue fraction to a red-dominant spectrum. Basil carotenoids rose 1.8 times under the highest blue fraction tested.
A 2021 lettuce study went further and tested whether the peak wavelength of blue light matters, not just the red-to-blue ratio. Blue LEDs peaking at 435 nm and 450 nm produced different plants under otherwise identical red-blue ratios. At low light intensity, the 435 nm treatment produced antioxidant activity 53 and 420 percent higher than the two comparison spectra. At high intensity, the same 435 nm treatment increased shoot fresh weight 14 to 36 percent and boosted assimilation rate up to 100 percent over a 450 nm blue source. A fifteen-nanometer shift in the blue peak changed outcomes by double digits.
Put the three studies together and a spec sheet reading “full spectrum” or “red-blue” stops being enough information. The peak wavelength inside that blue channel, and the exact ratio of red to blue photons, both move mineral and antioxidant outcomes by ranges most buyers never see quantified.
What This Means for Fixture Selection
Nobody should rip out a working full-spectrum white fixture over this research. None of the three studies cited here tested broad-spectrum white LEDs against monochromatic or red-blue light, so there is no direct evidence a white fixture underperforms a tuned red-blue recipe on minerals. The research does support something narrower and more useful: a grower running a narrow-band, budget-oriented fixture, especially a red-heavy or blue-heavy bar sold on a low price point, should ask for the spectral power distribution chart before assuming it delivers the same nutrient profile as a broader-spectrum unit.
For growers selecting fixtures with independently dimmable red and blue channels, the practical move is running trial batches at different ratios and testing tissue mineral content instead of trusting a marketing claim. Mineral analysis costs far less than a season of underperforming crop, and the shungiku study shows the swing between spectra can be large enough to matter for any grower making a nutrition-based sales pitch.
AGL has covered where spectrum marketing outruns the science before, including its look at UV and far-red supplemental lighting claims. For the light math behind the worked example above, see PPFD, DLI, and grow light efficacy explained. Growers comparing DLC-listed fixtures by efficacy and spectral output can browse verified listings in the AGL grow light directory.
Does this study prove red-blue LEDs beat white LEDs for mineral content?
No. Researchers tested only red, blue, and combined red-blue light, not a broad-spectrum white LED. The study shows monochromatic light underperforms red-blue light. It does not compare either spectrum type to a full-spectrum white fixture.
What crop did the 2026 study use?
Shungiku, scientific name Chrysanthemum coronarium, an edible chrysanthemum common in East Asian cooking. Researchers grew it hydroponically in a controlled environment.
How much did iron and zinc content change between spectra?
Leaves grown under monochromatic red or blue light carried 34 to 70 percent less iron and 40 to 50 percent less zinc than leaves grown under combined red-blue light.
Does more light intensity always raise nutrient content?
Not past a point. Higher PPFD raised biomass, sugars, antioxidants, and micronutrient content up through 300 µmol m⁻² s⁻¹, the highest level tested, but light use efficiency peaked earlier, at 200 µmol m⁻² s⁻¹. Maximum nutrient yield and maximum photon efficiency happen at different setpoints.
Is a 12-hour photoperiod better than 16 or 24 hours?
For growth, in this study, yes: a 12-hour photoperiod produced more leaf area and biomass than 16 or 24 hours at the same daily light integral. Researchers did test it: the 12-hour photoperiod produced 2.3 times higher iron and 1.3 times higher zinc than the 16-hour photoperiod at the same daily light integral.
Does red light hurt every nutritional measure?
No, and that is the trade-off worth remembering. Red-only and blue-only light both raised total phenolic compounds 81 to 90 percent above red-blue light, even as they lowered iron, zinc, and biomass.
Should growers switch spectra based on one study?
One study on one crop calls for testing, not a wholesale fixture swap. Older research on lettuce, kale, spinach, basil, and pepper points in the same direction, which makes the pattern worth a grower\u2019s own trial rather than a dismissal.
How can growers check a fixture\u2019s real spectral output before buying?
Ask the manufacturer for the spectral power distribution chart, not a marketing label like full spectrum, and cross-check the fixture against DLC\u2019s horticultural qualified products list for verified photosynthetic photon efficacy and spectral data.